


In this tutorial I am going to make you a pro at using and leveraging the Wireshark TCP Graphing tools. As many of you who have taken my Wireshark Courses know, I am a big fan of visualizing what is going on in a given packet capture or conversation. My #2 troubleshooting step is to view the I/O Graph, for example (read more here).
In all there are five different TCP Graphing tools available to us in Wireshark’s Statistics menu, as shown in the screenshot:
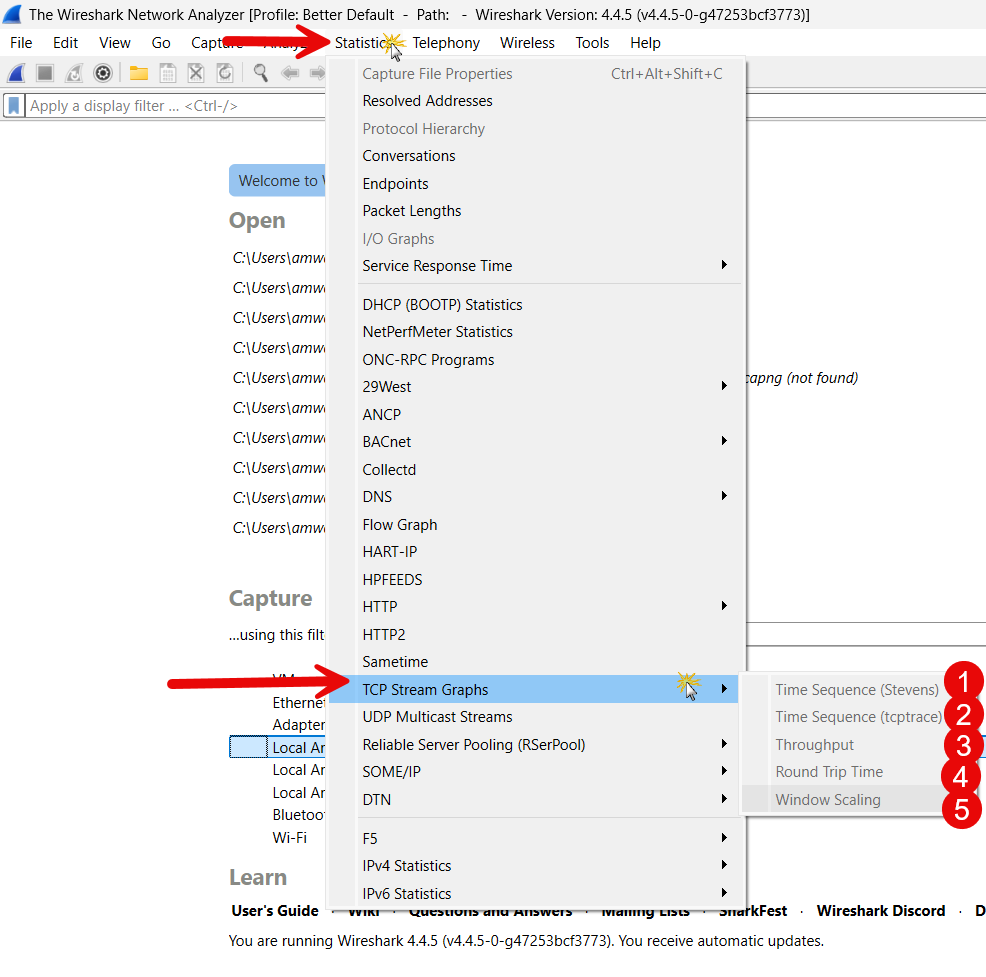
What we will do is look at each one of these. We will need packet captures that will show us what is going on, and allow you the reader to follow along seamlessly with this tutorial.
This is just a start, you will find the complete article and learning at our Patreon community. You will find the complete post here. Thank you to our patreons for your support.
Comments and technical discussion are always welcomed from registered users below, and you are also invited to continue the conversation with the community on our Discord server. If you would like to help support the continued development of independent networking, broadband, Wi-Fi, VoIP, and packet analysis content, please consider joining our Patreon community where you will gain access to exclusive technical resources, downloadable labs and PCAPs, bonus course content, troubleshooting guides, and additional member-only material. You can also support our work by simply buying us a coffee — every contribution helps us continue creating practical, real-world network science education for professionals and enthusiasts alike.