

| Check out these great references as well: |
|---|
| Our custom profiles repository for Wireshark |
| Our Udemy course on Wireshark |
| Our Udemy course on Wireless Packet capture |

When you first start using Wireshark you will find that the great folks at Wireshark provide us with a “Default” profile. This is where we all started.
Now that default profile has been adjust over time, but never by much.
We will call this our Zero starting point. Here is what it looks like:
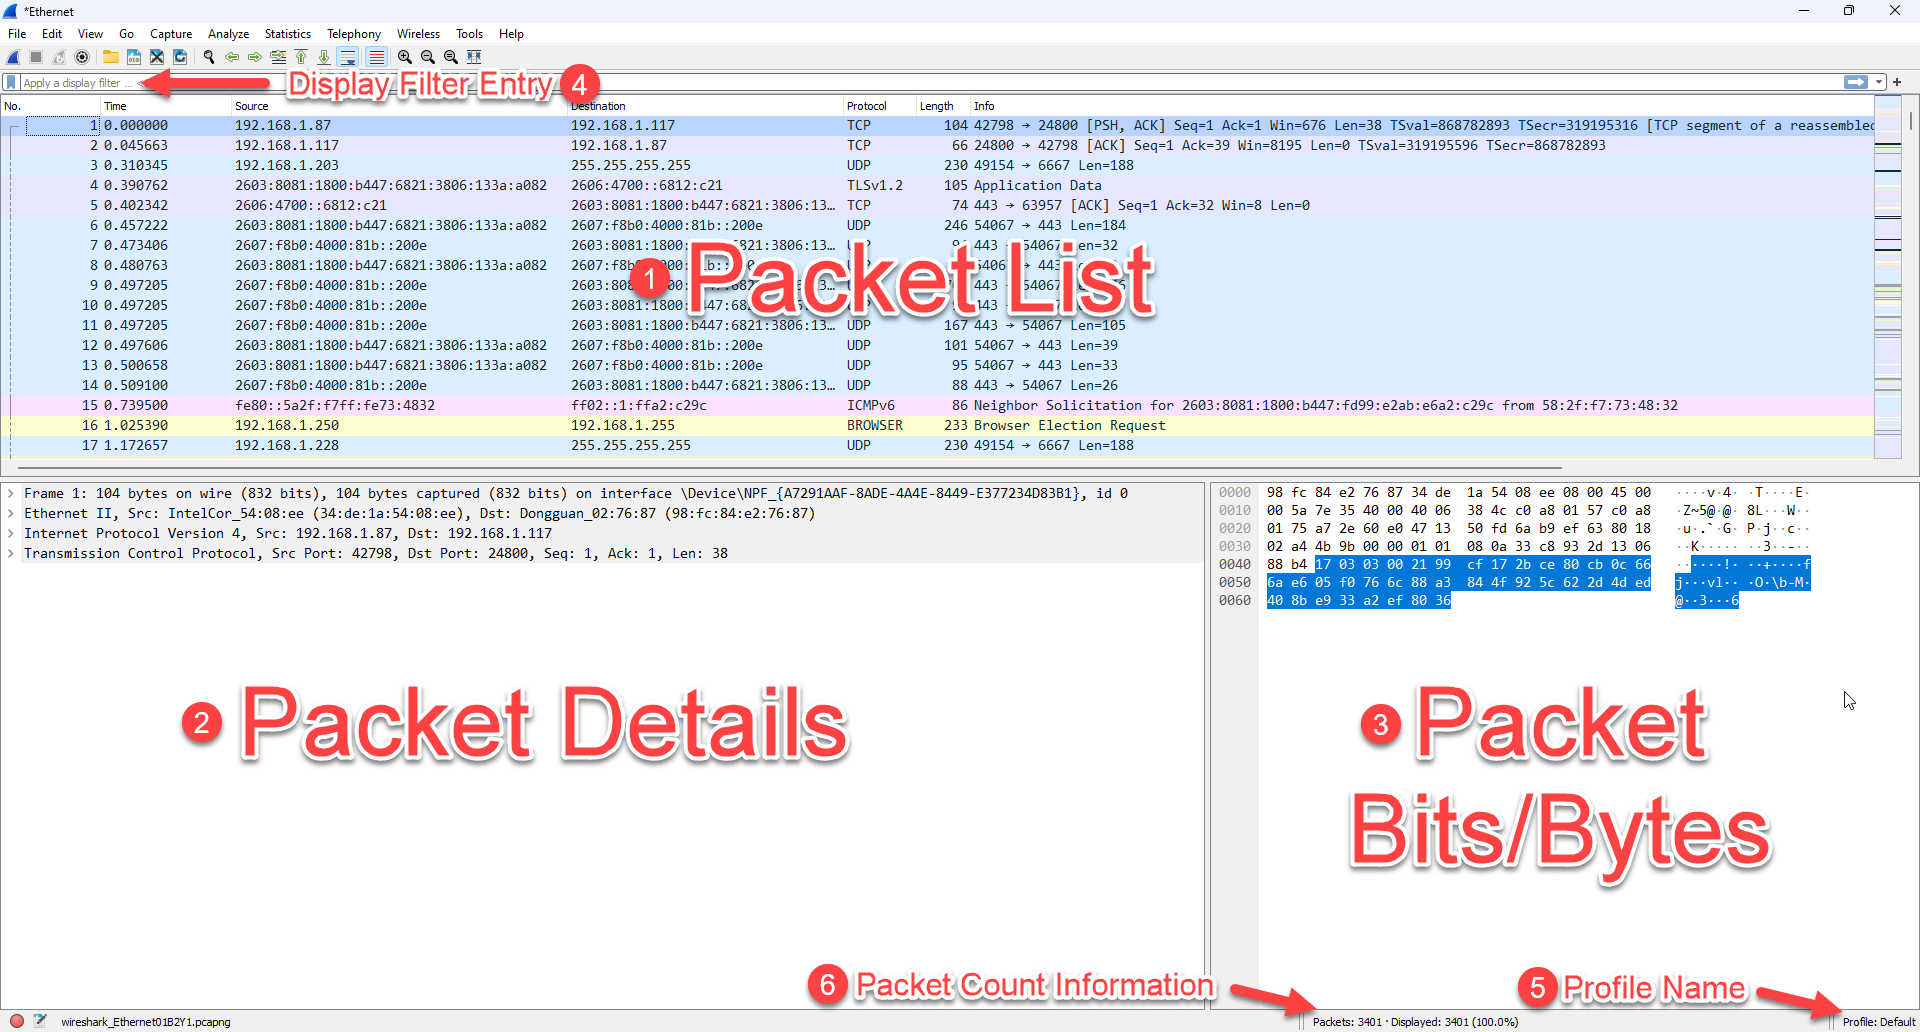
That default, whilst a great starting point leaves very much to be desired as your experience with Wireshark grows, and even arguably from day one.
It is not long before you are wondering what else we can add and what else is important to troubleshooting a given packet capture. The truth is, there is a lot that can be customized with Wireshark. In this article, I am going to focus on Wireshark’s columns.
First, a couple of things about the columns. Clicking on any column header causes Wireshark (like a spreadsheet) to sort on that column. You can see below, #1 – I clicked on the Protocol column, and then #2 – I clicked on the “Go to the first packet” button in the tool bar, and #3 – I note a little up arrow appeared on the column indicating that the column is sorted in ascending order:
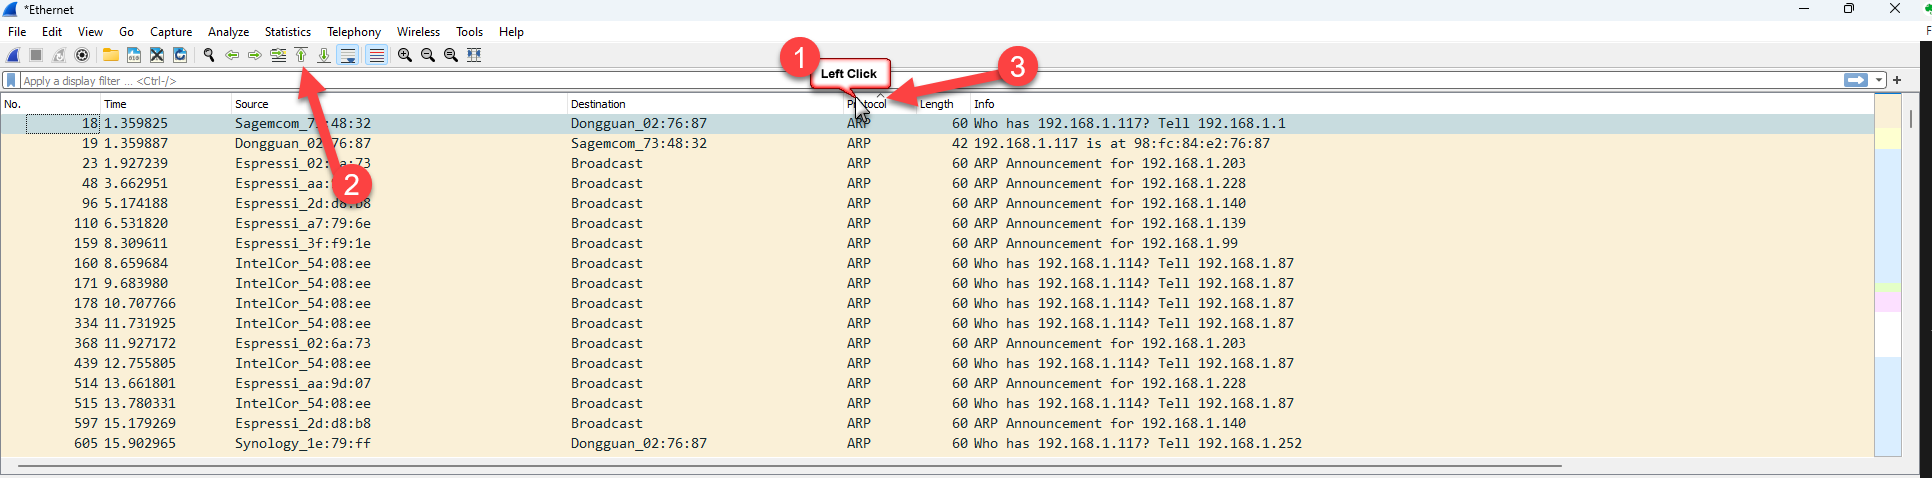
Clicking the title of the column a second time with resort, this time descending order and the arrow will change to the downward direction indicating the order of the sort.
Now, the immediate concern is that the number order of the packets has changed, so to return the packet list to the usual number order, we simple click on the No. column to sort in ascending order, and then that handy button to jump to the top of the list, and we are back to the normal view of the packet list.
You can imagine that sorting based on column content could be quite helpful when looking for a particular protocol, or a particular source or destination address. In the end the sort is perhaps not specific enough, but this is a good starting point.
The Default Columns
In the default profile there are seven columns. Let’s discuss what the contents are of these seven columns:
- No. This is the number of the packet in the capture. It will always start with one, and count upward. This is essentially the order in which packets were captured. Can packets get out of order? Sure, however we will discuss this is a different article. If one was to apply some sort of display filter, then this column will show which number match your filter.
- Time. This is one of the timestamps wireshark tracks for each packet. This particular timestamp is a reference of time from the first packet in the capture. It is a good and quick way to view the packet list in a timeline perspective. That said, this leaves a lot to be desired. There is a section to follow where we will dive into how we can use other timestamps and how we can modify this column.
- Source. Simply this is either a) the Source IP address of the packet, or b) the Source MAC address of the packet, or it is left blank if neither of those can be decoded. Layer 3 is preferred over Layer 2, but if there is no Layer 3, like in an ARP packet, the Layer 2 address will be displayed.
- Destination. This column behaves much like the Source column, expect this time it is either a) the Destination IP address of the packet, or b) the Destination MAC address of the packet, or it is left blank if neither of those can be decoded. Layer 3 is preferred over Layer 2, but if there is no Layer 3, like in an ARP packet, the Layer 2 address will be displayed.
- Protocol. This column appears somewhat arbitrary at first. It is not. Wireshark attempts to find the highest layer protocol when it decodes the contents of a packet, and then places that protocol type in this column. For example this may be UDP or TCP, or even QUIC. Usually after those protocols, data is encrypted, so you will not see HTTP. So if you want to know how much web browsing traffic there is, filtering for ‘http’ or ‘https’ may not show as many packets as say filtering for ‘tcp.port==80’ as an example. The content here is also affected by what protocol dissectors are enabled or disabled (you can enable of disable certain protocol dissectors in the Analyze> Enabled Protocols drop down menus).
- Length. At first glance, this seems simple: it is the size of each packet, right? Well that would be close. When a packet is captured on your machine, it is process by the Network Interface (often called a NIC). So the packet is processed by the NIC before it is sent into the system’s protocol stack. Wireshark gets a ‘sniff’ of that packets once it has arrived in the protocol stack. So if the NIC does something like check the Frame Check Sequence (FCS) (4 bytes) and then remove that information, that is not seem in the Wireshark display, and importantly for this column, those bits and bytes are not included in the Length column. When NICs do this they usually also remove the Ethernet preamble (1 byte) as well. You can see that this column represents what Wireshark sees is the length of the packet, and depending on the capture device, not the actual number of bits that were transmitted on the physical media. It’s OK. In the end, we usually end up looking at things like Maximum Transmission Unit (MTU) size, or Maximum Segment Size (MSS) as issues, and not necessarily the true length of a given packet/frame.
- Info. Think of this column as an attempt by the Wireshark program to provide summary information of what this particular packet is about. For the most part, the program does this very well. However, sometimes, this information is not helpful, or cannot be helful for a number of reasons. The content is dependent of the highest level up the protocol stack that Wireshark can decode, like the Protocol column. It is also dependent, just like the Protocol column, of what protocol dissectors are enabled. More on that later.
This is just a start, you will find the complete article and learning at our Patreon community. You will find the complete post here, plus a Wireshark Columns Lab to practice this knowledge. Thank you to our patreons for your support. . Thank you to our patreons.
Be sure to check out our Wireshark Profiles here: https://www.cellstream.com/wireshark-profiles-repository/
Comments and technical discussion are always welcomed from registered users below, and you are also invited to continue the conversation with the community on our Discord server. If you would like to help support the continued development of independent networking, broadband, Wi-Fi, VoIP, and packet analysis content, please consider joining our Patreon community where you will gain access to exclusive technical resources, downloadable labs and PCAPs, bonus course content, troubleshooting guides, and additional member-only material. You can also support our work by simply buying us a coffee — every contribution helps us continue creating practical, real-world network science education for professionals and enthusiasts alike.